
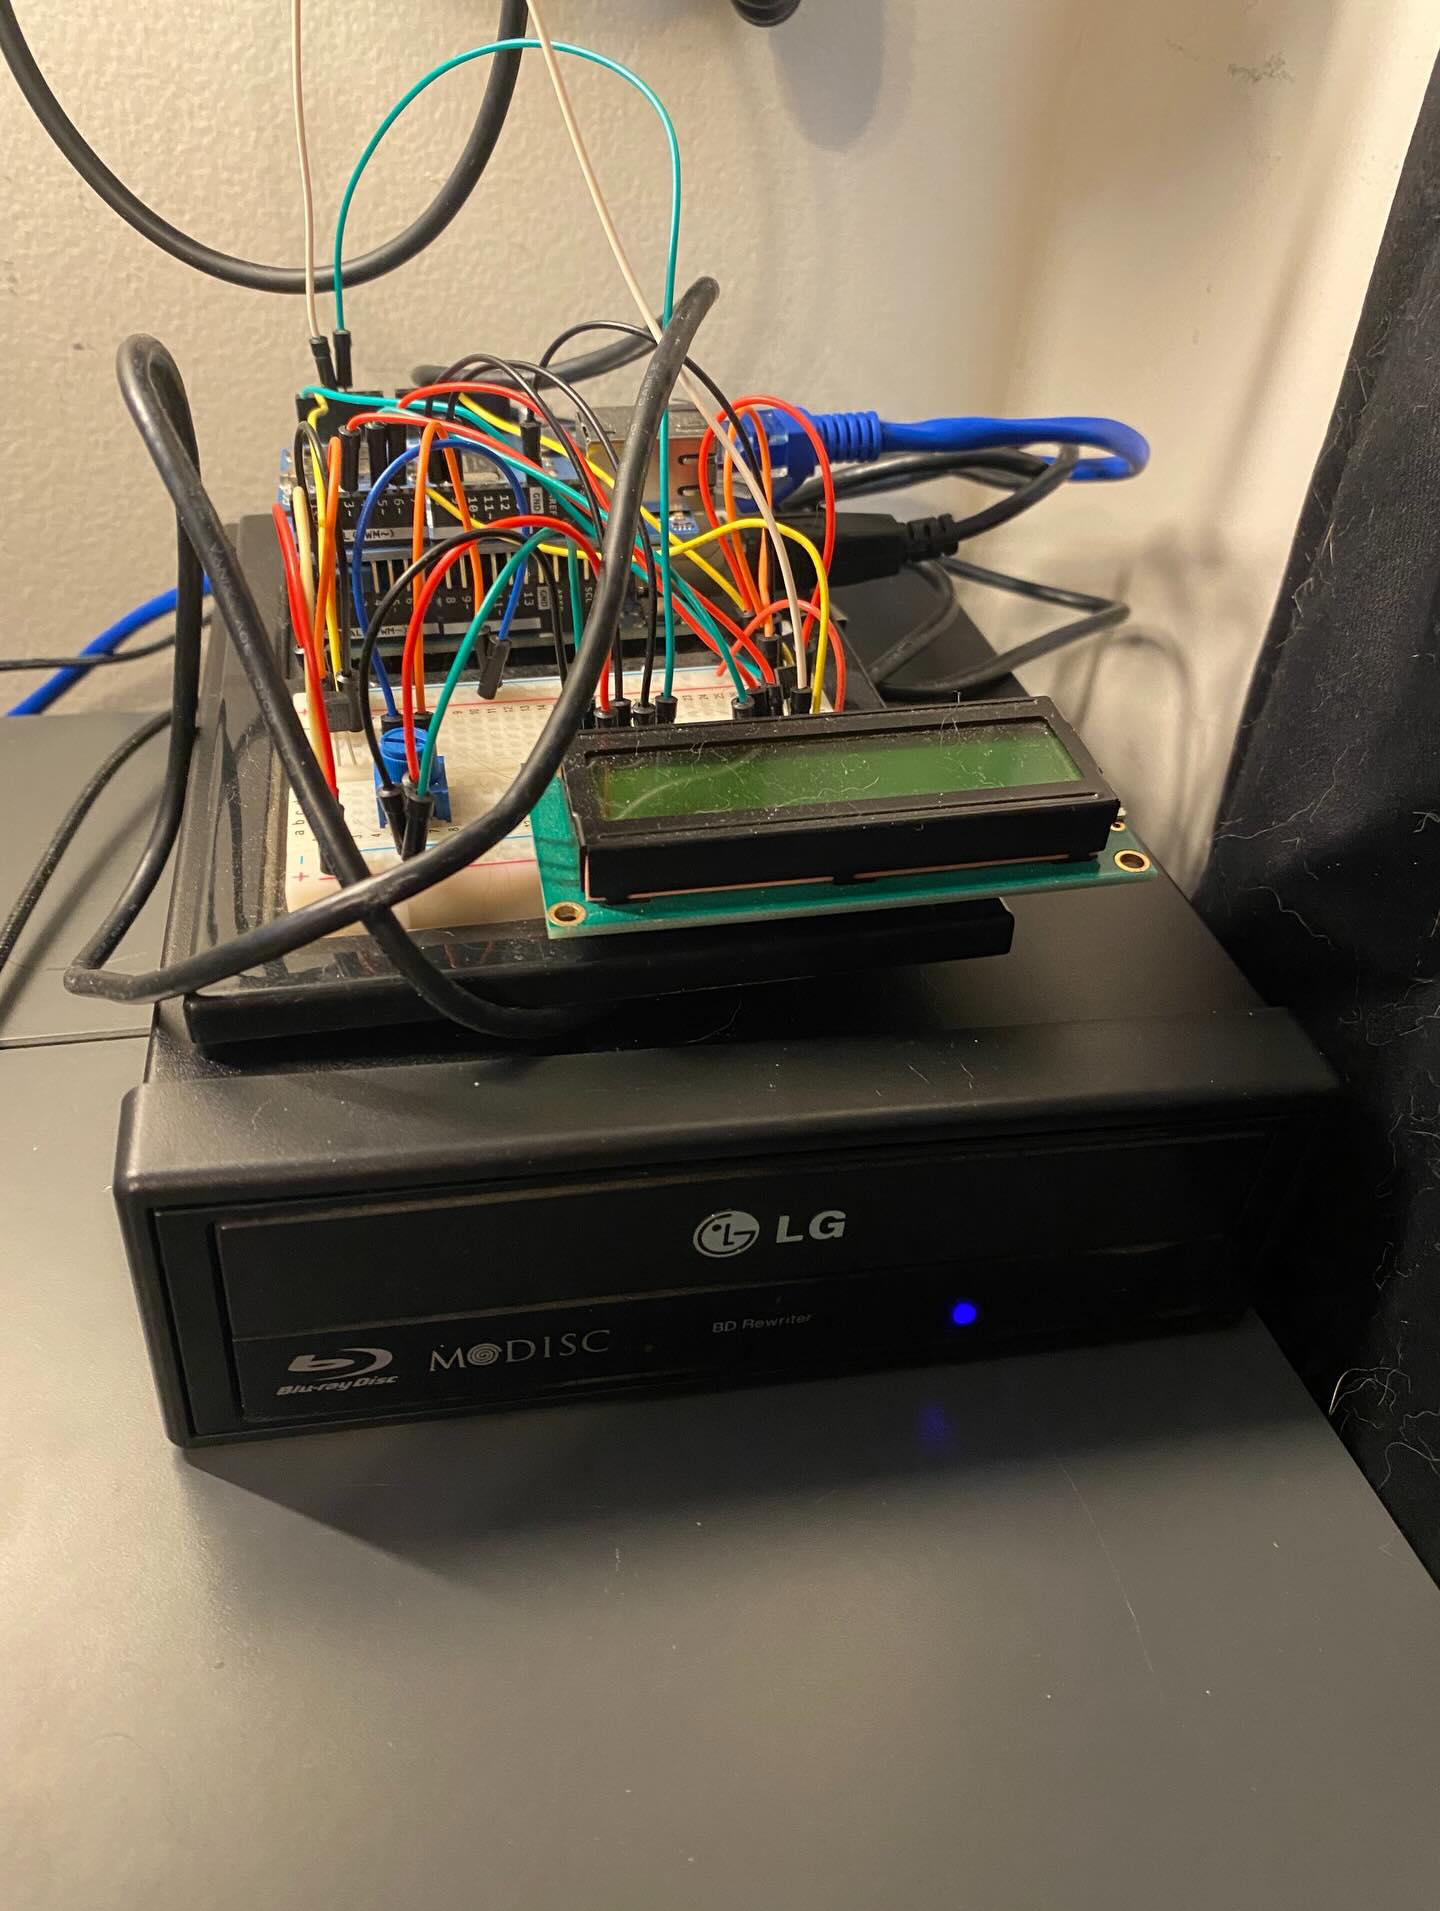
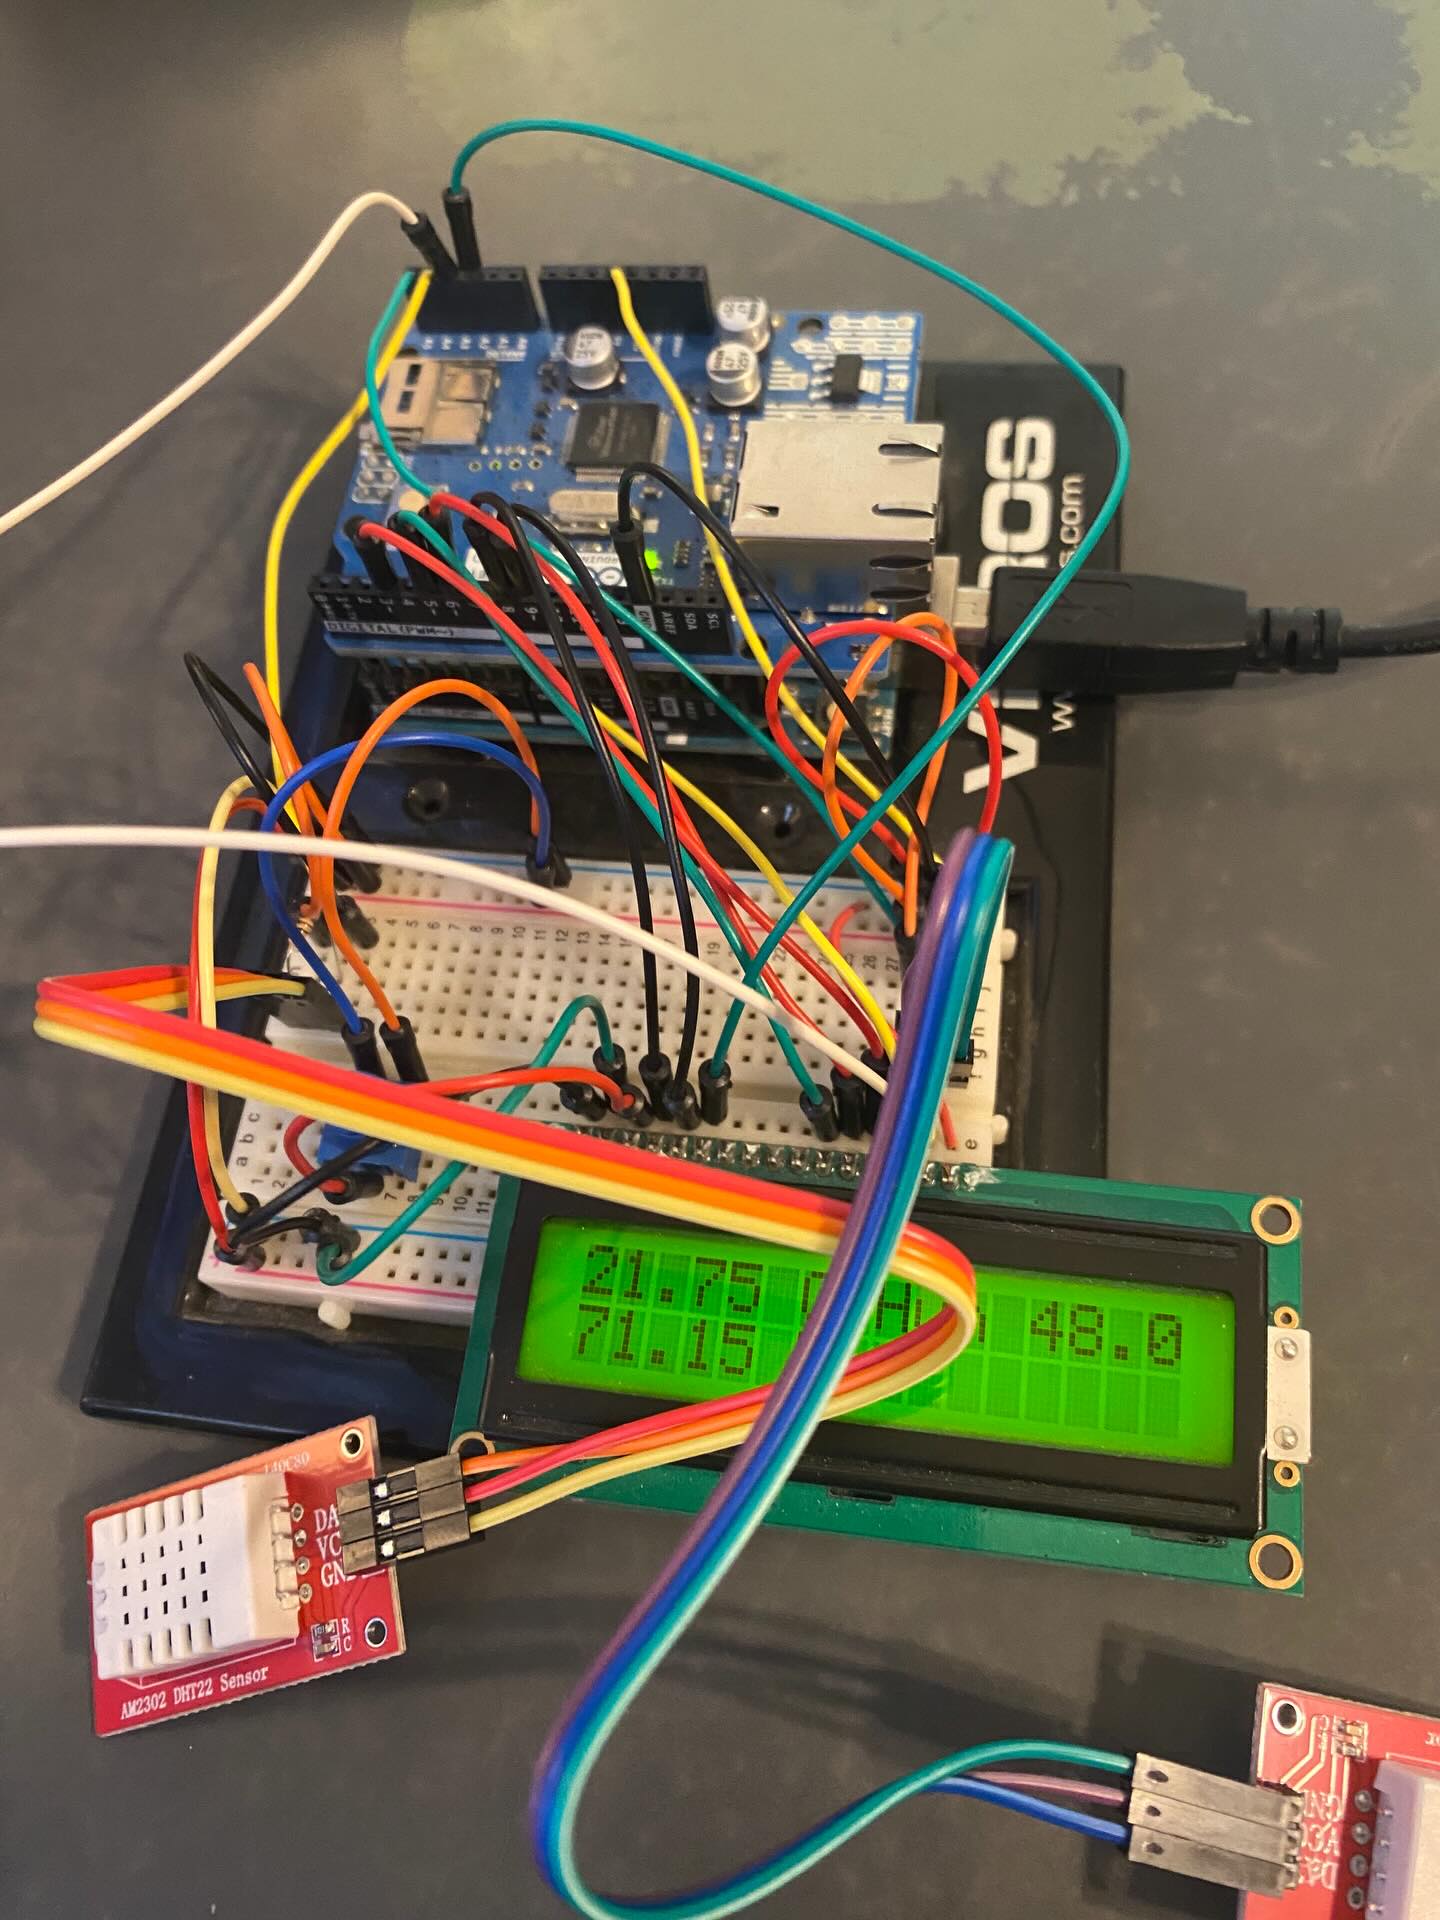
Temperature probes are the sensing layer of any environmental monitor. In a garage or workshop, they translate physical heat and moisture into numbers the rest of the system can store, graph, and alert on. This project uses digital humidity–temperature sensors wired to an Arduino, with multiple probe channels so you can compare zones instead of trusting a single reading. For the full build story, read the temperature probe case study.
What probes measure in practice
Each probe reports two values that matter for day-to-day decisions: air temperature and relative humidity. Temperature tells you whether pipes, paint, or stored goods are approaching risky limits. Humidity helps explain condensation on cold surfaces, rust on tools, and whether dehumidification is worth running overnight.
Probes in this build expose their readings through a JSON object keyed by probe index—
0, 1, and an computed avg across active sensors. That
structure maps cleanly to dashboard labels such as “North wall” or “Workbench area.”
Common probe uses in garages
- Freeze protection: Track overnight lows near exterior walls before plumbing is at risk.
- Seasonal comparison: Compare attic-adjacent zones with the floor level during summer heat.
- Equipment health: Watch humidity around metal tools, batteries, or paper storage.
- Work comfort: Validate whether insulation or ventilation changes actually help.
- Remote checks: Glance at live readings while away instead of guessing from outdoor weather alone.
Placement matters more than sensor cost
A probe near an uninsulated garage door will swing wildly every time the door opens. One on a north-facing wall may lag outdoor temperature by hours. For stable trends, mount probes away from direct sun patches, moving air from fans, and heat sources such as freezers or water heaters. Shoulder height (4–5 feet) usually represents the air volume people and stored items experience.
Why multiple probes beat one
Garages are not uniform boxes. A single sensor might read 45 °F near the floor while the ceiling bay is 58 °F on a sunny winter afternoon. Multiple probes reveal gradients, bad insulation spots, and which area represents the risk you care about. The firmware averages active probes so the history page still has one summary snapshot per load while preserving per-probe detail on the home page.
From probe wire to web page
Probes do not talk to the website directly. The Arduino sketch reads each sensor on a schedule, validates ranges, and publishes JSON over HTTPS. The site fetches that feed, maps keys to human labels you configure in the dashboard, and optionally saves readings when you are signed in. Try the interactive probe demo to see how multiple zones and averages behave, or read the end-to-end data flow guide.