
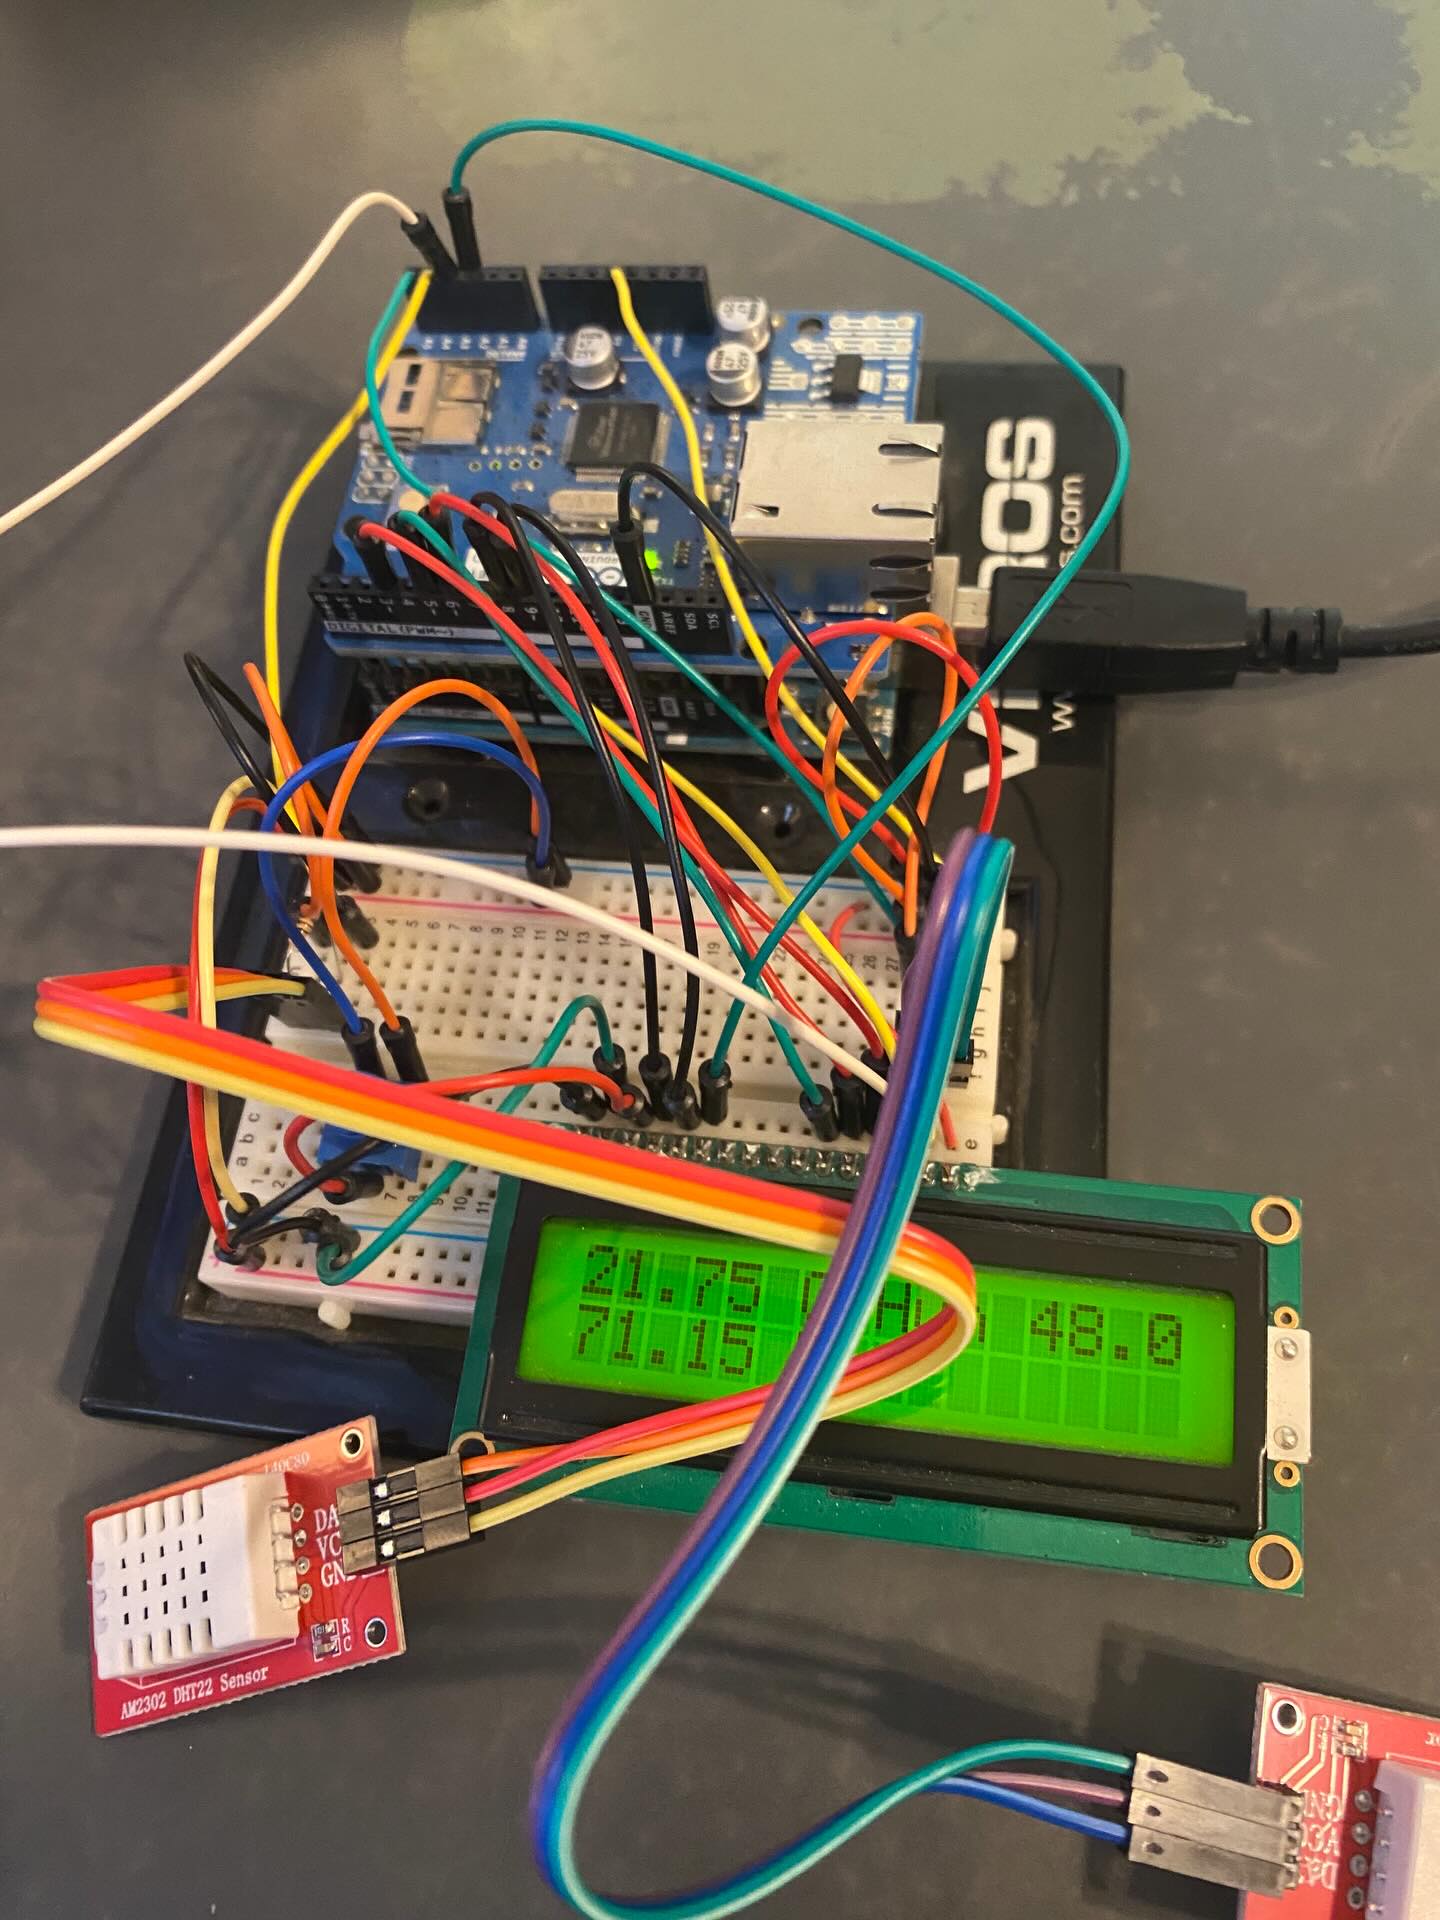
This case study follows the temperature probe build that powers ThermalTrace: why a single outdoor thermometer was not enough, how two DHT22 zones plus an averaged summary were chosen, and what changed between the first breadboard deployment and the network-connected revision now serving live JSON to this website.
The challenge
The goal was practical, not academic—know whether an attached garage was approaching freeze risk, whether humidity was creeping high enough to rust tools, and whether conditions differed near the door versus the back wall. Consumer weather apps only report outside air at the nearest station, which can differ by ten degrees or more from an insulated garage interior on a sunny winter afternoon.
A single sensor would have hidden the gradients that matter. Opening the overhead door, parking a warm vehicle, or afternoon sun on a west-facing wall all move different parts of the space at different speeds. The case for multiple probes was clear before the first wire was soldered.
The environment
The monitored space is a typical attached garage: one large overhead door, concrete slab floor, limited insulation compared to living space, and seasonal swings driven as much by sun load and infiltration as by outdoor temperature. In summer, the door-facing zone runs hotter; in winter, the slab and north wall lag outdoor lows by hours.
- North wall zone: Slower to change; useful for overnight low trends.
- Door zone: Spikes when the door opens; flags rapid infiltration.
- Workbench area: Represents where work actually happens at shoulder height.
The interactive probe demo models these three zones so you can see how sun load and door state pull readings apart without installing hardware.
Approach and hardware
Each probe uses a DHT22 digital humidity–temperature sensor on a short cable from an Arduino Uno.
The firmware reads both sensors on a timer, retries transient bus errors, computes an
avg across healthy probes, and serves compact JSON over the local network via an
Ethernet shield. A 16×2 LCD on the board shows live values for on-site checks without a laptop.
Placement followed the rules in the
temperature probes guide: away from
direct sun patches and exhaust fans, roughly shoulder height, with ventilated mounting so air
could move past the sensor head. Labels in the dashboard map JSON keys
0 and 1 to human-readable zone names.
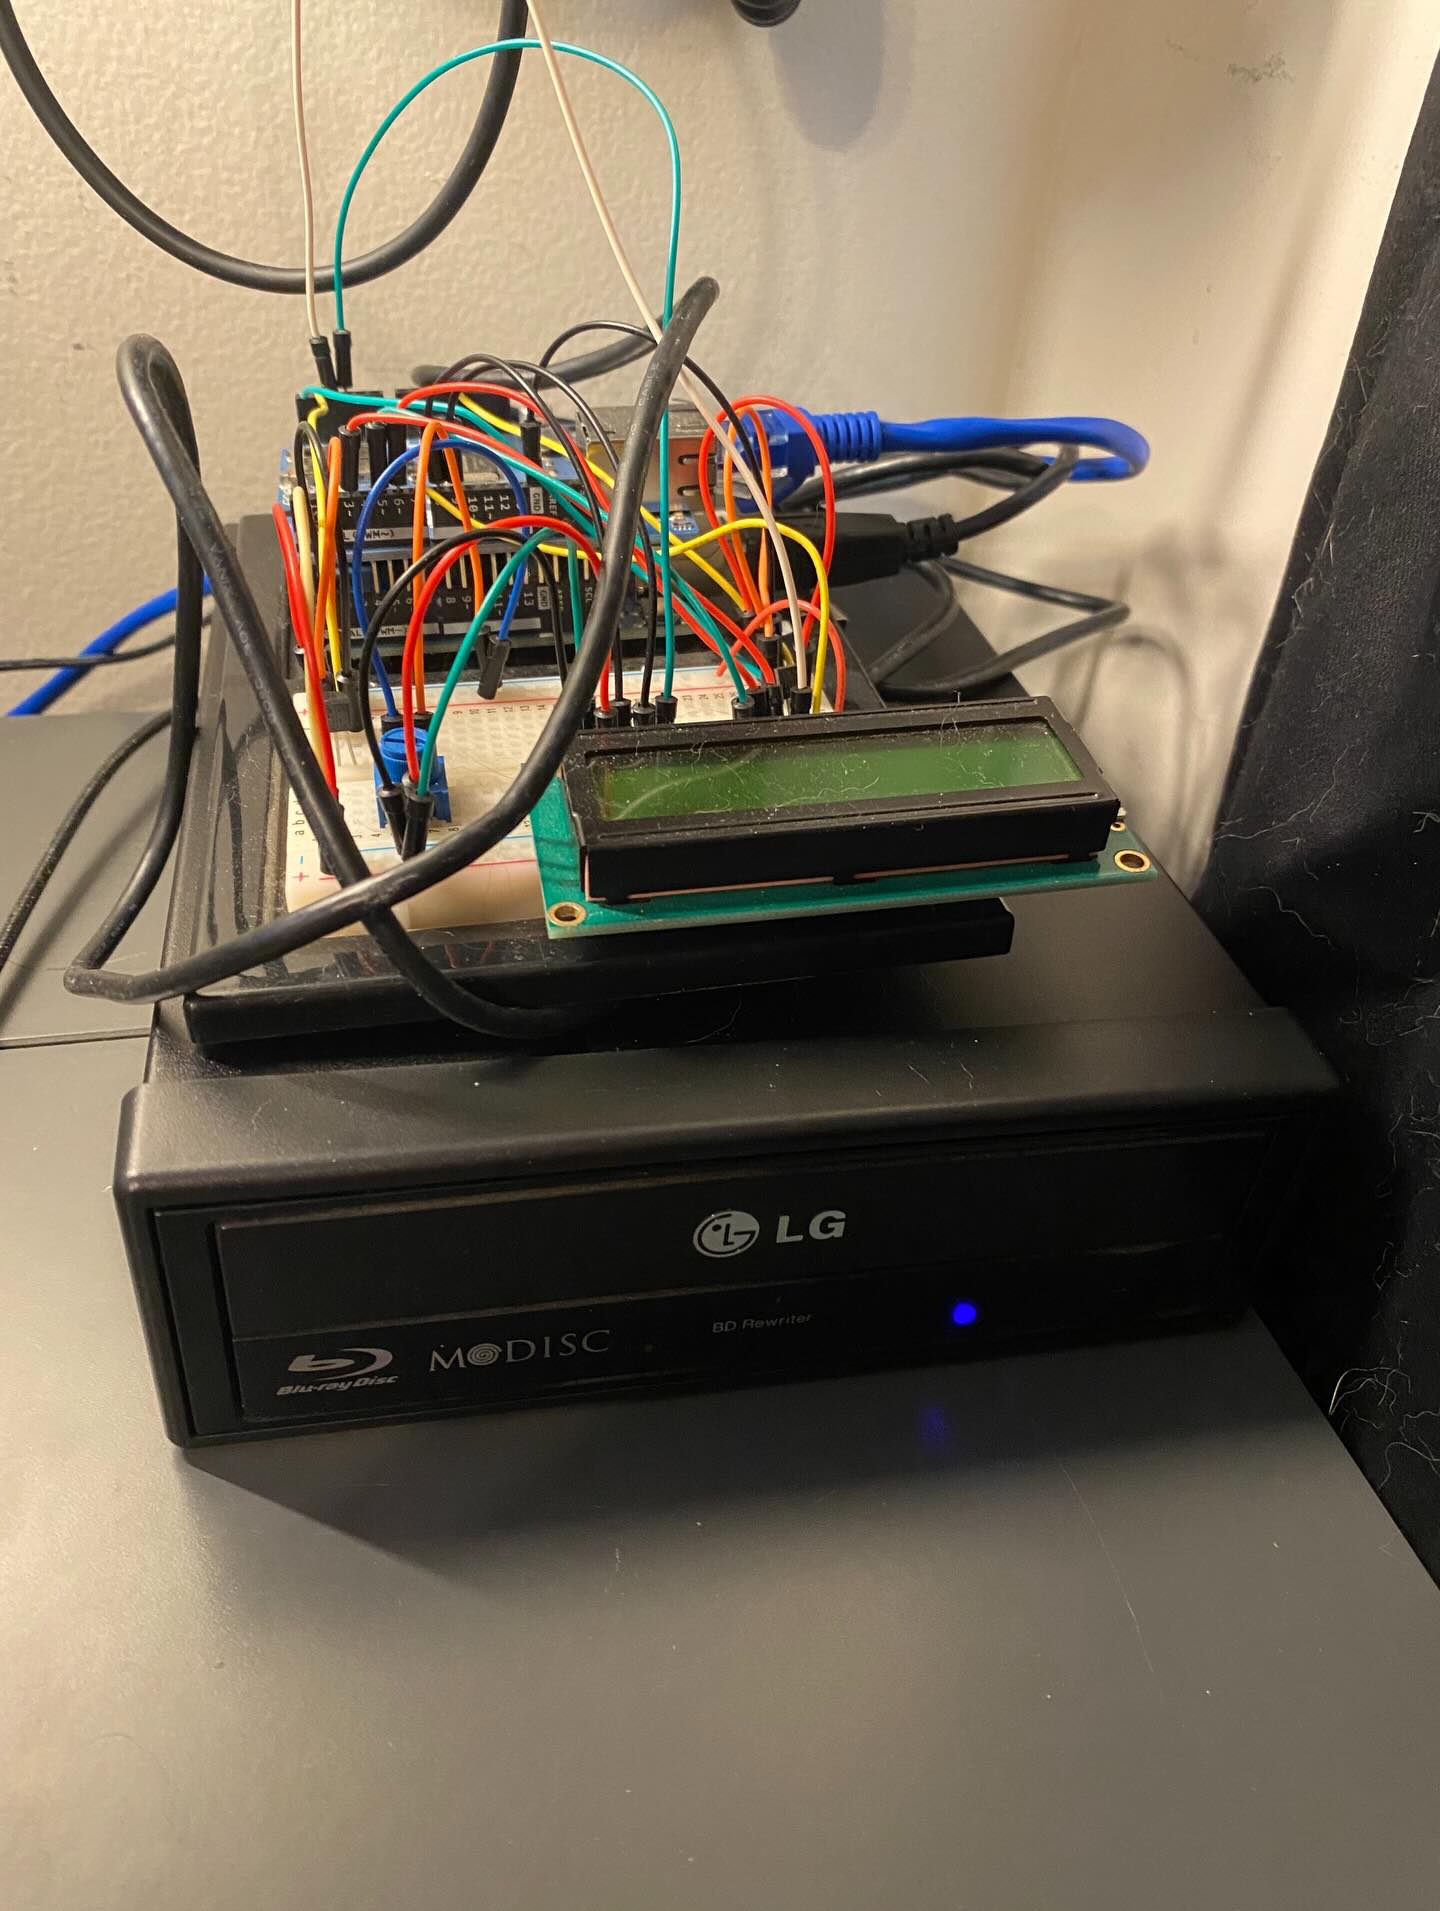
Build timeline
- Bench bring-up: Serial logging confirmed DHT22 reads, LCD formatting, and stable
tempJSON keys before the board left the desk. - Revision one in the garage: Proved multi-probe gradients were real—the door zone routinely diverged from the north wall on commute schedules.
- Network JSON feed: Ethernet removed the need to carry a laptop for every check; the site could fetch the same document the LCD already displayed.
- Revision two: Cleaner stacking of the Ethernet shield, refined probe headers, and watchdog-friendly reboot logic for rare network hangs.
- Website integration: Astro pages map feeds to cards; signed-in history stores snapshots for trend review and CSV export.
What the data showed
After a full winter and summer cycle, the probes paid off in ways a single reading would have missed:
- Door-adjacent temperature could swing 8–12 °F within minutes of opening the overhead door while the back wall moved modestly.
- Overnight lows near the north wall tracked freeze risk more reliably than outdoor forecasts alone.
- Humidity rose after sustained cold spells when the slab was slow to warm—useful for deciding when to run a dehumidifier.
- The computed average smoothed noise for history charts while per-probe cards on the home page preserved zone detail.
Readings flow from probe to dashboard along the path documented in end-to-end data flow. When TLS at the edge was needed, a Python relay cached upstream JSON without pushing that complexity onto the microcontroller.
Lessons learned
- Placement beats sensor cost: A well-mounted DHT22 outperformed a poorly placed premium sensor every time.
- Label zones in software: Stable JSON keys with dashboard labels kept firmware and website loosely coupled.
- Expect gaps: Reboots and network blips create short gaps—distinguish them from misconfiguration using the stale-reading guides.
- Build for iteration: Revision one on a breadboard saved a ladder trip when pin assignments changed.
Related reading
Continue with the temperature probes overview, Arduino sketches guide, what causes readings to move, and historical data usage on the dashboard. Firmware source: arduino-network-json-temperature-sever.